
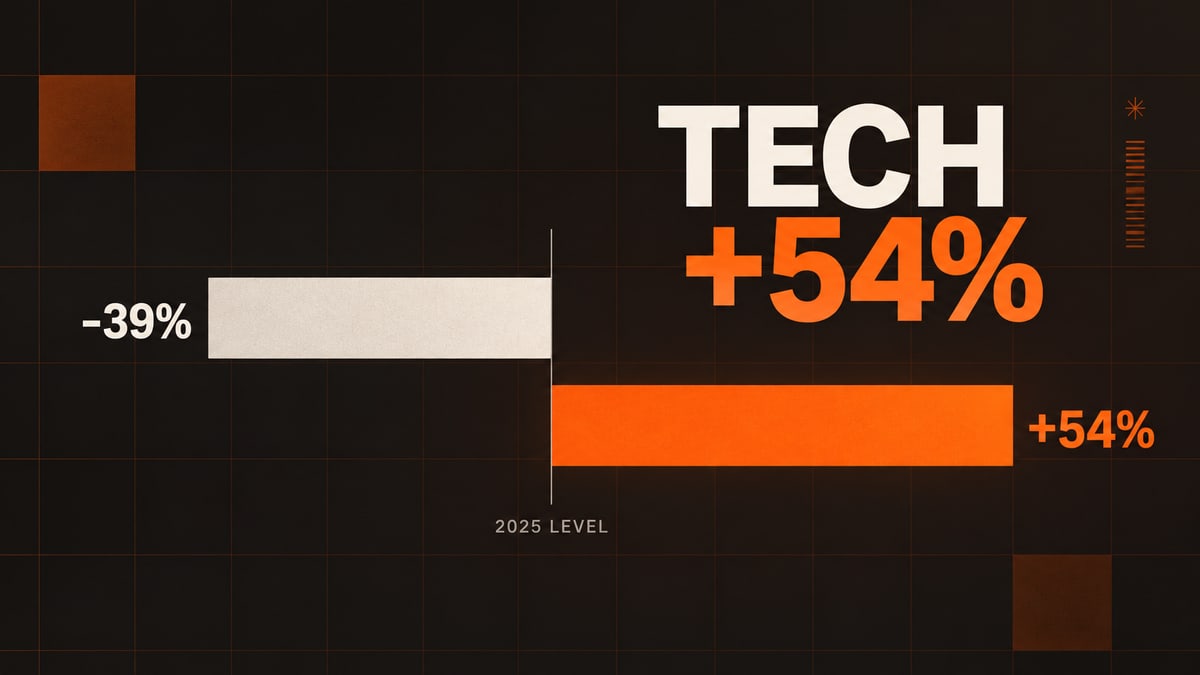
Layoffs are at a four-year low. Tech cuts are up 54%, with AI the most-cited reason.
Both headlines are true. Three-quarters of the aggregate calm is arithmetic, and one sector is running a completely different labor market.
This Coffee Cup AI analysis follows the evidence behind AI job loss and workforce change. On October 1, CBS News reported that U.S. layoffs had fallen to a four-year low: employers announced 573,195 job cuts through September, down 39% from the same stretch of 2025 and the quietest January-to-September since 2022. Four weeks earlier, the same underlying data had produced the opposite-feeling headline, repeated monthly since spring: artificial intelligence is the single most-cited reason for job cuts this year, named in 120,136 announced layoffs, about 21% of the total.
Both numbers come from Challenger, Gray & Christmas, the outplacement firm that tallies every announced cut. They are not in conflict. They describe an economy where the layoff rate as a whole is calm and where one sector is purging itself, a pattern also visible in Microsoft layoffs due to AI and Copilot buyouts. Through September, technology companies announced 165,925 cuts, up 54% from a year earlier, while everything else shrank.
Twenty-six of thirty industries are quieter. Four are not.
Challenger tracks thirty industries, and twenty-one of them announced fewer cuts this year than last. Government cuts fell 92% after 2025's federal workforce reductions. Retail is down 83%. Warehousing, telecommunications, and services all roughly halved. The exceptions are transportation (+190%, absorbing elevated costs and shifting trade conditions), food producers (+76%), fintech (+331%, off a small base), and technology. Tech is the largest of the four, and the one most tied to AI.
The arc of the year: calm arrives, tech doesn't join it
In the monthly numbers for 2026, the total and tech moved separately. Total cuts opened with a January shock (108,435, the highest January since 2009, driven by UPS severing ties with Amazon and Amazon's own 16,000-role management restructuring), climbed to a May peak of 97,006, then fell to September's 43,281, the lowest month since December 2025. Tech followed its own rhythm: a May spike of 38,242 cuts, the sector's heaviest month since August 2024, then a fade to 6,103 in August, then a 77% September jump to 10,799, just as Amazon cut nearly 1,000 more retail-division roles in early October.
Three-quarters of the decline is the federal purge ending
The 2025 comparison year was inflated by the government's layoff wave: federal and state agencies announced 279,445 cuts in the first quarter of 2025 alone. Through September 2026, government cuts are down 92% year over year, from roughly 299,755 to about 23,010 (our calculation from Challenger's totals and its ex-government figures). That single sector explains 276,745 of the 373,231-cut decline between the two years, or 74%.
Challenger itself publishes the cleaner comparison, and excluding government, announced cuts are down 15% versus the 39% headline figure. Against that corrected baseline, tech's +54% stands out even more: the sector is moving in the opposite direction from everything else.
What the AI number says
"AI is the #1 stated reason" comes with a qualifier: it is the top reason year to date, and it was the top reason in each month from March through July, five consecutive months. By September it had fallen to fifth for the month, cited in 3,961 cuts, about 9% of September's total, behind market and economic conditions.
That trajectory is visible in AI's share of each month's cuts. It peaked in May at nearly 40%, per CNBC's read of the May report, ran at 31% in June, about 17% across July and August (computed from Challenger's cumulative figures), and 9% in September. The wave of AI-cited layoffs crested in late spring. It is still historically enormous: 120,136 AI-cited cuts in nine months is roughly double the entire year of 2025, when AI appeared in about 55,000 announcements, and it is the first year AI has topped Challenger's reason list since the firm began tracking it as a distinct category in 2023.
Is "AI" the reason, or the excuse?
Paul Osterman, professor emeritus at MIT Sloan, told Fortune in May that companies have used "smaller, flatter, more productive" language for two decades: "AI is a perfect excuse to justify big layoffs. It makes it seem as if it's not our decision, our fault, it's the technology." The market rewards the excuse. Cisco's stock jumped 13% after it announced 4,000 cuts. Wix's CEO cited the strong shekel and AI in the same breath when cutting 20% of staff.
The data cuts against pure washing, though, in the clustering. If AI were a generic cover story, AI-cited cuts would be spread across all thirty industries in proportion to their cuts. Instead they concentrate in the one sector whose cuts are rising, and Challenger says so directly: "AI is now the leading reason companies give for cutting jobs and the primary industry citing it is Technology." That concentration is hard to square with a generic excuse.
The data also argues against taking every AI citation at face value. Andy Challenger himself attributed January's 16,000-role Amazon cut to overhiring and delayering rather than to AI. And the AI-cited share falling from 40% to 9% between May and September, while tech kept cutting at an elevated rate, suggests the label is applied opportunistically at the margins even where the underlying restructuring is real. Challenger's April formulation is the most precise one available: "Regardless of whether individual jobs are being replaced by AI, the money for those roles is." Companies are shifting budget lines toward AI infrastructure, and headcount pays for it. That is a real mechanism whether or not a model performs any given job.
Why three credible research shops disagree, and why they're all right
Research shops disagree about whether AI is costing jobs this year. Challenger says AI is the top cited reason for layoffs. The Yale Budget Lab, analyzing Current Population Survey data, finds measures of AI exposure "show no sign of being related to changes in employment or unemployment." Stanford's Digital Economy Lab, working from ADP payrolls, likewise reports no "widespread, economy-wide job displacement," while finding employment for workers ages 22 to 25 in the most AI-exposed occupations running about 19% below trend. Goldman Sachs economist Pierfrancesco Mei, using the BLS Displaced Worker Supplement, finds the displaced bear real scars: about a month longer to find work, roughly 10 percentage points more likely to still be unemployed a year later, and among reemployed long-tenured workers, only 49% earning as much as before, down from 62% in the prior survey.
The disagreement fades because each dataset covers a different scope. Announced cuts are plans, concentrated in a few sectors. Employment surveys measure net levels across 160 million jobs, where even the full 120,136 AI-cited cuts round to about 0.08% of employment and vanish into noise. Displaced-worker surveys track individuals after the fact, where concentrated damage shows up in how long the search takes and what the next paycheck looks like. A purge that is devastating inside tech and adjacent white-collar hiring is arithmetically invisible at the national level.
| Source | What it measures | What it found in 2026 | What it structurally cannot see |
|---|---|---|---|
| Challenger, Gray & Christmas (monthly, announcements) |
Publicly announced cut plans by sector and stated reason | Tech cuts +54% YTD; AI cited in 120,136 cuts (21%), top reason for the first time | Whether announced cuts were executed; whether AI did the work or took the blame |
| Yale Budget Lab / Stanford Digital Economy Lab (CPS, ADP payrolls) |
Employment and unemployment levels by AI exposure | No measurable economy-wide effect; but a ~19% employment gap for ages 22–25 in AI-exposed jobs (Stanford) | Concentrated, sector-local damage; anything smaller than national aggregates |
| Goldman Sachs / BLS Displaced Worker Supplement (individual outcomes) |
What happens to specific workers after displacement | AI-displaced workers: ~1 month longer to re-employ, +10pp still unemployed at one year; 49% pay parity vs 62% prior | Workers never hired in the first place (the entry-door problem), and real-time sector totals |
What to do with this
If you work in or adjacent to tech, the national unemployment picture doesn't measure your risk. Unemployment is hovering near 4.1% and jobless claims remain low, which tells you the economy is stable and nothing about your sector. Use the sector table above instead, where what matters is your industry's year-over-year cut trajectory and whether employers in it are citing AI. Adjacent sectors matter too. Fintech (+331%) and the chemical sector, where Challenger says AI is the primary cited reason, are outside "tech" but inside the same budget-reallocation logic. So does transportation, whose cuts come from trade costs instead of AI.
If you lead a team deciding on AI adoption, the Federal Reserve's small-business AI adoption and hiring data offers a useful counterpoint. Three data points from this year should sit next to the ROI spreadsheet. The cut-then-reverse pattern is documented: Orgvue found 32% of organizations that let people go for AI had to rehire, and Ford brought back 350 engineers in June after AI quality-control tools underperformed. The displaced-worker data says the scar is real and lands hardest on experienced people, which is your retention and reputation problem, not just theirs. And the market's applause (Cisco +13%, Block's stock jump after its January cuts) rewards the announcement before any outcome is known. Announcing cuts and getting them right are different projects, and this year's data only measures the first.
What to watch next: Challenger's October report lands Thursday, November 5, and will capture Amazon's October retail and devices cuts, which arrive after the September data this piece uses. The October numbers should show whether AI regains any monthly share after September's 9%, and whether tech cuts keep their September bounce or resume the summer fade. Holiday hiring plans are already running well below last year's (September's hiring announcements were the weakest since 2011), so the quiet in layoffs is not matched by loudness in hiring. The wait-and-see posture Andy Challenger describes could break in either direction.
Notes on uncertainty
- Challenger counts announced cuts, not executed ones, and only those it can document through press releases and WARN filings. Real job loss is higher than announced job loss, and the gap is not evenly distributed across sectors.
- "AI-cited" is a stated reason, chosen by the employer writing the memo. It captures the label companies attach to cuts, which is why it cannot by itself settle the washing-vs-conviction question.
- Our government-sector split for 2026 (23,010) is derived by subtracting Challenger's published ex-government totals from its grand totals; the monthly PDFs round sector figures, so the split is accurate to within a few hundred.
- The May AI share (~40%) comes from CNBC's read of the May Challenger report, not from the May PDF itself; the July–August share (~17%) is our computation from cumulative June and September figures, so it masks month-to-month variation.
- Goldman's "AI-displaced" group is modeled, not surveyed: no BLS question asks whether AI cost someone their job. Goldman scores occupational AI exposure and treats the top 30% as likely AI-displaced. The estimate is directionally careful but not a headcount.
Sources
- Challenger, Gray & Christmas, September 2026 job-cut report (PDF), released Oct 1, 2026. Monthly totals, tech sector figures, AI-cited totals, reasons, industry changes.
- Challenger monthly reports for January, March, April, May, June, July, August, and December 2025 (PDFs).
- CBS News, "U.S. layoffs in 2026 are down nearly 40% from last year, labor data shows," Oct 1, 2026.
- Fortune, "CEOs blame AI for layoffs, but an MIT professor says it fits a long-running pattern to find a cover story," May 31, 2026 (Paul Osterman, Wix, Block, Cisco).
- Fortune, on Pierfrancesco Mei's Goldman Sachs note analyzing the BLS Displaced Worker Supplement, Oct 30, 2026, including the Yale Budget Lab and Stanford Digital Economy Lab findings.
- CNBC Make It on AI rebounding (May AI share ~40%; SHL/Orgvue reversal data), Oct 30, 2026.
- CNBC on 2025 full-year AI-cited cuts (~55,000), Dec 21, 2025.
- Harvard Gazette / HBS Working Knowledge, "AI Hasn't Spurred Widespread Layoffs Yet. Why Not?" Oct 20, 2026 (Elmendorf, Fuller, China-shock comparison, 4.1% unemployment).
- Reuters on Amazon's October retail-division cuts, Oct 8, 2026.
All year-over-year comparisons in this article use January–September periods. Percentages we computed (the 74% government share of the decline, the 11%→29% tech share, the July–August AI share, and the 2026 government total) are labeled as calculations and follow from Challenger's published totals.